


A road map to choosing the right mapping/GIS software
In this article we compare a few industry-leading mapping/GIS software packages. It offers a brief, pragmatic overview and some advice and criteria on how to choose the right package for your specific requirements. We discuss their use for novices and professionals and list some guide prices.
To approach this topic in style, let’s ‘put these packages on a map’!
User landscapes
Here we go.
Because there are so many different packages and different users, and because we only have limited space, the map to show these packages on has to be a small-scale map, like a road map. The nature of a small-scale map is that some features, like main roads, are exaggerated to make them very clear, while other features, like buildings, are displaced to leave room for, let’s say, wider road lines. And finer detail…? Well, that is left out altogether. That is all fine, since it is just a small-scale map and serves a specific purpose. This simplification process is called ‘generalisation’.
We will apply this generalisation principle to ‘map out’ these software options, knowing we fall short on finer detail. But first:
Who needs mapping software anyway?
This question is the elephant in the room, and it is not so hard to answer. Hobbyists and enthusiasts aside, let us focus on professionals. Most professionals dealing with ‘land’ or ‘spatially related information’ (buildings, cables and pipes, assets, etc.) will have to deal with maps, map data and map making.
This is the 21st century. Life without a computer is unthinkable. Artificial intelligence is rapidly changing the way we work. Still producing maps with a pencil, sticky tape and a photocopier will not reflect well on the producer or organisation. Grant applications, land registration, land management: all of these are nowadays done online, digitally or with handy apps.
Most map data is digital, and to be able to analyse it and work with it we need flexible software. There is a lot of valuable digital data available online, ready to be used. And so it is that any larger organisation simply must have some mapping capability to be able to integrate, compare, analyse and work with such data. Apart from larger organisations (which definitely need some serious mapping capability), we can narrow this broad group of ‘land managers’ down a bit further.
For example, those wielding a chainsaw or lawnmower eight hours a day might perhaps consult a map once in a while, but are unlikely to need to actually make a map. At the other end of the spectrum we find land and asset managers at the top of a larger organisation. These managers, too, probably seldom have to actually draw a map or interact with a (digital) map. And if they do need to, they probably have staff whom they can direct where to draw the line.
This leaves us with a group of professionals (foresters, ecologists, biologists, land agents, etc.) who need mapping software. We can in fact be rather specific.
Who needs mapping software:
those who keep a pair of wellies in the boot of the car because they need to be ‘on site’ frequently or periodically.
It is this group of professionals who should be able to knock up a map as easily as they fire up MS Excel or MS Word. It is this group who are ‘in the know’ about ‘what is where’. If these managers are not able to work with mapping software, they are rather disadvantaged. And so mapping software must be learned, to add it to the toolset of this day and age.
There is quite a range of mapping software on the market to choose from: some is free, some is affordable and some is very expensive.
Where to start?
Analogy
Prospective and novice map makers often start with a statement like: “I only need to draw a few lines on a map and print them, that is all, no bells and whistles. Anything more would be too complex for me; I don’t need anything fancy anyway.”
Fair enough. It is a simple mission statement, like wanting to fly from A to B in a simple, elegant and efficient fashion. Like so:

But guaranteed: no sooner have we mastered the first take-off and are airborne than…
the farm manager, also using the software, says: “Yeah, great, I can do this! Now I also want to spray my crops…”

After those skills are mastered (it is doable), the forester has some additional specific needs:

The marine biologist or ecologist, having learned these easy basics, now wants to approach this map just a tad differently:
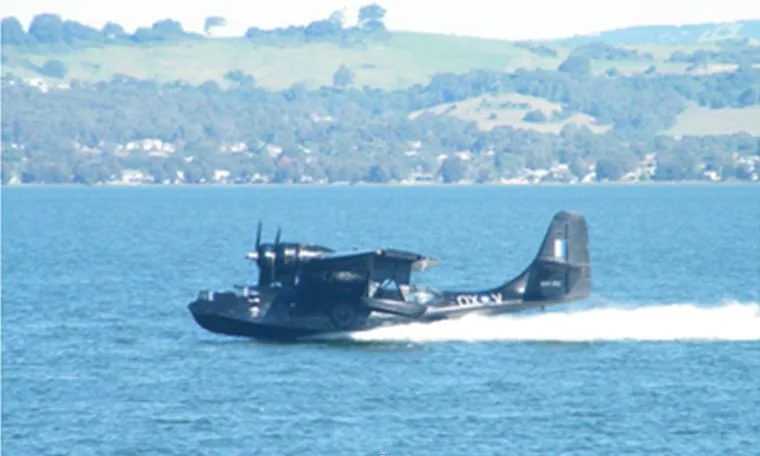
After the first maps are made, the land agents, the self-employed and those multi-tasking will soon want some serious oomph:

whilst those working in larger organisations really need something big to handle large data sets:

…Golly! …By now it has become a three-man job to fly or land the jolly thing…!
The functionality of these aircraft is often reflected in the increasing number of controls in the cockpit:


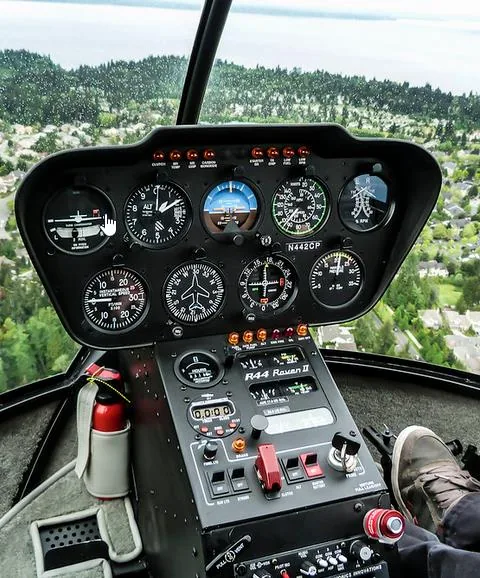
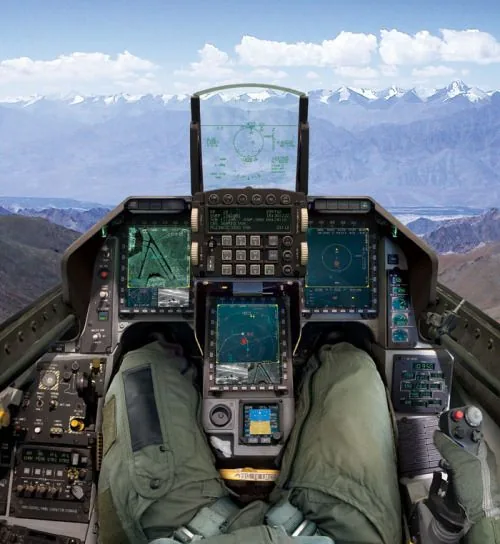

Translating this back to software, interfaces can range from something as simple as this:
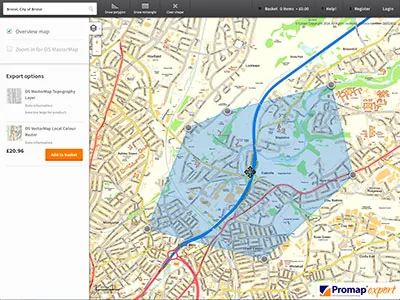
…to something more complex, like this:
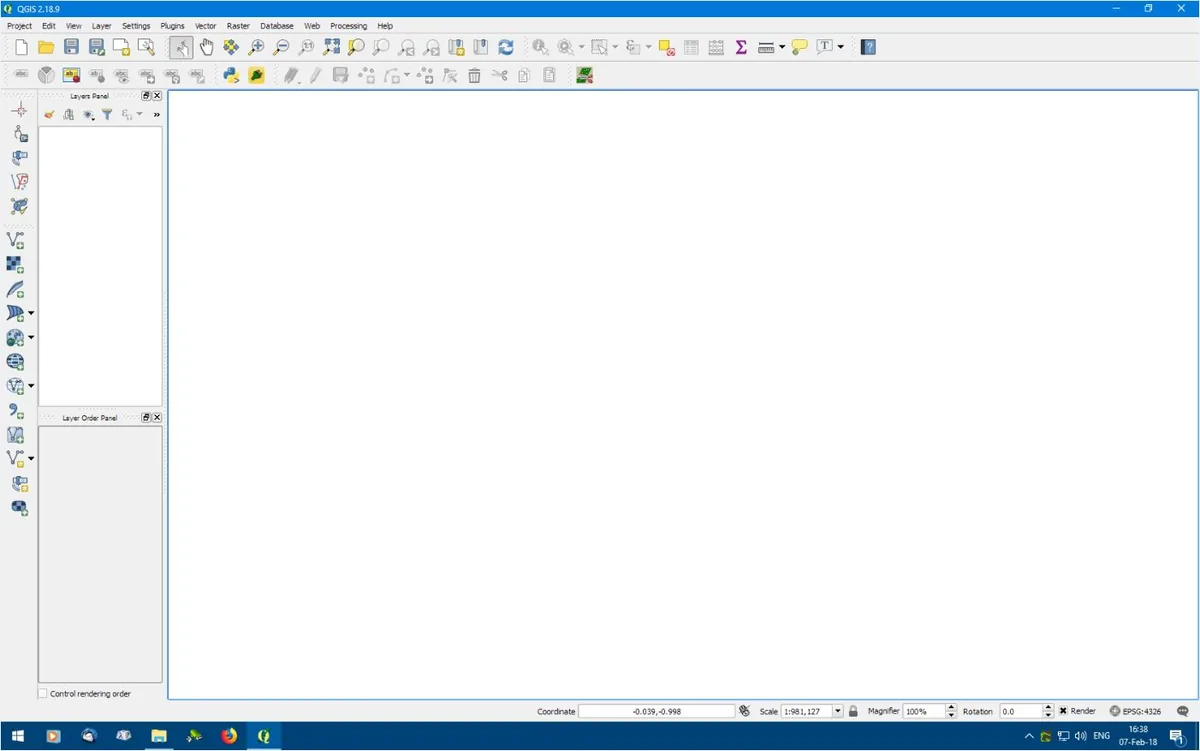
As said, this is usually how it goes: “I only want something simple…”, and as soon as that is mastered, more is required…
Naturally, each of these aircraft has its strengths and weaknesses, and each comes with a different price tag. So how do we narrow down what we really need and want?
Software contours
First, a few words on typical industry jargon. The buzzword is GIS, which stands for Geographic Information System. This type of software allows the user to work with map data. By design, its core purpose is to work with existing data, but naturally the user can draw a brand-new map in it as well.
To keep things simple at this stage, we will talk about ‘mapping/GIS’ packages, because there is more on the market than just the big GIS packages.
Zooming in, let’s irreverently squeeze all mapping/GIS packages into only two groups:
- one-trick ponies;
- multi-functional packages.
One-trick ponies can be very efficient, slick and easy to use, but offer little flexibility. Industry-standard packages offer immense flexibility, but there is far more to learn.
a. One-trick ponies and horses for courses – considerations
Import/export
In the early days of working with digital map data (and computing in general), software packages often tied the user into their brand and way of working. This is, in general, no longer the case. There are industry-standard file formats, and any good package will be able to import and export data using these standard formats. Creating maps and map data/layers is a time-consuming activity, and if a particular software package does not allow you to import and export your data in these industry standards (ArcGIS formats at the least), we would be reluctant to use it, however tempting it may seem.
Security
Although most packages will allow you to export your data for use in another package, a new phenomenon is emerging: some packages are web-based. The user can no longer physically download and install the software on their PC, and in some cases the data you draw lives somewhere in ‘the cloud’, on remote servers. That means you are tied into their regime. Furthermore, anything digital can be hacked, no matter how big the firm and no matter how well its security measures are advertised (think of incidents where even government data was leaked). The bulk of the map layers produced may not contain super-sensitive data, but think of the time it took to create them: do you really not mind being dependent on an external supplier to access your data…?
Cost
The cost of using such online/on-demand software seems small and can, for example, be charged per print, reducing the cost to a bare minimum… or so it seems. However, you will soon find out that, when it comes to map making, you need a lot of prints: not only to make a high-quality map, but also in daily use. And then the costs of these seemingly cheap packages and services mount up, little by little, bit by bit.
Quality of output
The map is often the ‘visual end output’ of a costly and/or time-consuming project (like a field survey which took days and so cost a fair bit). Or it may lead to a costly and time-consuming new project: a sale of land, grant applications, planning permission, etc. In other words, the map is a key component in the presentation of your information. If you fail to present it well, your project may miss its aim.
The creators of these online packages are often keen to promote their services, so their names and logos may show up clearly on your work.
Furthermore, drawing a digital map is more than just some basic colours or pattern fills. You are communicating valuable information on your map, so you need control over its appearance. ‘One-trick pony’ software often offers easy access to a few default, standard lines and colours – but that’s it: there is often little creative or personal control. Bear this in mind when producing map output for your valuable and specific project.
Ease of use
These ‘one-trick pony’ packages can be (or should be!) very efficient and most user-friendly. That is to be expected, because they only do a few things, so there is little to do and learn. We are repeating ourselves, but as soon as you are over the initial hurdle of the complexities of map making and you know how to draw a few lines with these basic colours and tools – we repeat once more – no sooner have you learned that than you will ask, “Can it also do this…?” or “I want it to look like that…”. And then the answer is: “No, it can’t be done, because this is a basic package.” And then you start looking for other software, and waste more time and money finding something that does work for you.
In other words, don’t start with something easy which will soon prove insufficient for your needs.
Dedicated packages
Then there are mapping tools developed by service providers who operate in a specific ‘non-map-making’ industry sector and realise that offering mapping capabilities enhances their core product. Think of forestry management software, terrier software, property maintenance software, etc. Such mapping tools are often, again, easy to use, as they are an efficient match for their core activities. Being able to program a smart administrative/management database package is one thing; developing a proper mapping/GIS package is of course a totally different ball game. So mapping software like this might be efficient and practical; however, these too are, in a way, ‘one-trick ponies’ and are no match for software developed specifically for map making and GIS.
b. Multi-functional packages
At the other end of the spectrum are the big, serious mapping/GIS software packages. There are quite a few about, and we will only touch upon the best known.
ArcGIS, AutoCAD, etc. (all named software: see the links below)
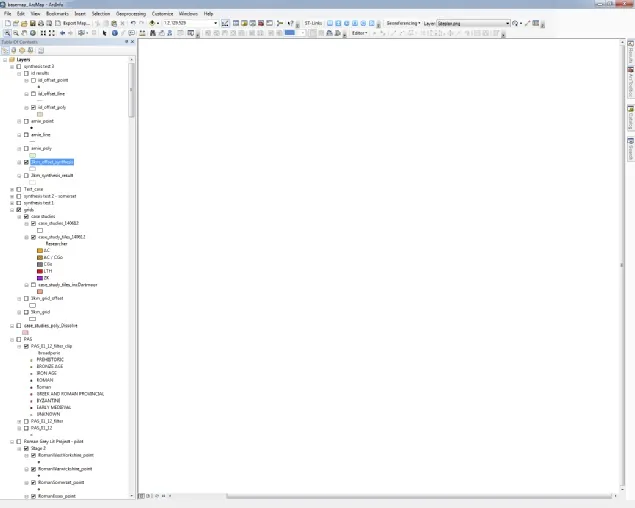
The undisputed market leader in GIS software is ArcGIS. In hot pursuit we find rival packages like MapInfo, Bentley and AutoCAD. In days long gone, the first two were like Coca-Cola and Pepsi: they had conquered and divided the world between them. Big, formal organisations use packages like these.
These packages rule the world because they are good, well known and a standard.
If, for example, you ever need to dig up a road to replace a cable, want to coordinate this with all the other utility services, have all their data on your mobile and have it projected in your augmented-reality glasses so you can see in 3D where the cables are whilst looking at that road, then these are the tools that offer the integrated apps and functionality to do all that.
Mind-boggling and spectacular. But like the aforementioned sugary soft drinks: though they may rule the world, that does not mean they are all that healthy for you too. Bear that in mind when choosing a package!
Packages like this come with a hefty price tag: four-digit sums for a single PC licence, followed by annual licence fees. An office licence will have a five-digit price tag plus annual licence fees, and then it is not uncommon to need an extra module to do this and another to do that…
Because they serve the entire world with all its GIS needs, the learning curve to master these excellent tools is quite steep indeed. Usually a formal course must be followed to get going with the software. Or, to put it back into the aeroplane analogy, as mentioned: when working with big software like this, “one would almost need three people to land the jolly plane”.
This type of software is for people and organisations who are happy to spend money and have the time to learn it. Given the complexity of such packages, it warrants a full-time GIS officer (or team), and that in turn could soon lead to a bottleneck in the organisation. Working in land management, it is essential that the data we work with is up to date and can be distributed or processed quickly. We all know from experience that as soon as ‘another department’ is involved in helping us, things start taking more time.
Not only that, but drawing maps – knowing where to draw a boundary, to what scale and with what accuracy – is not something an office-based software technician is well placed to do (nor solicitors, for that matter). This is the realm of skilled cartographers, or of those managers who actually manage the landscape and produce this type of data. (We’ll come back to this conundrum later.)
The times they are a-changin’…
Be aware that the quality of software cannot be gauged by its retail price or a fancy website. There are very good packages around with a very affordable price tag (or no price tag at all!). Even amongst the big, formal corporate users, things are changing.
For example, the Norwegian national mapping agency, which serves up its maps through web portals to a range of other organisations and users, has opted for open-source software to provide these services. Open-source software is, of course, free. It is programmed by a collective of enthusiasts, professionals and/or hobbyists.
Many of us know about ‘free’ software, which we download from obscure web pages covered in advertisements, so that we first download and install three packages we don’t really want. We then end up with a polluted computer and, after many tests, trials and tribulations, eventually discover that the free software we thought would do the trick does not quite deliver as expected. And yet here we are: open-source, free software, in use in a very formal and secure national institution.
Enter:
QGIS
‘Quantum GIS’ saw the light of day as recently as 2002 and became open source in 2009. Initially it was basic and not all that impressive. However, more than ten years have passed and the GIS community has pushed it to spectacular heights. It is now even becoming a serious rival to the likes of ArcGIS!
QGIS is a totally free and excellent package, with functionality to make your head spin. And that shows in the interface: the icons and menu settings one needs to learn in order to apply all this wonderful functionality. This is an excellent package, particularly for those who enjoy nuts and bolts and appreciate a challenge.
Others well worth mentioning
Then there are packages which have found their way into the mapping/GIS world through the graphic design sector. Graphic designers and artists can draw, and therefore they can make beautiful-looking maps too (but not necessarily accurate maps!). The world-leading graphic design package used by such designers is Adobe Illustrator. There is, however, more to a good map than just stunning graphics. And so an add-on package was developed by another company (Avenza) which now serves the GIS world in an impressive way: MAPublisher. It is based on, and requires, Adobe Illustrator, which runs on a monthly licence: two packages in one, a lot of functionality, a lot to learn.
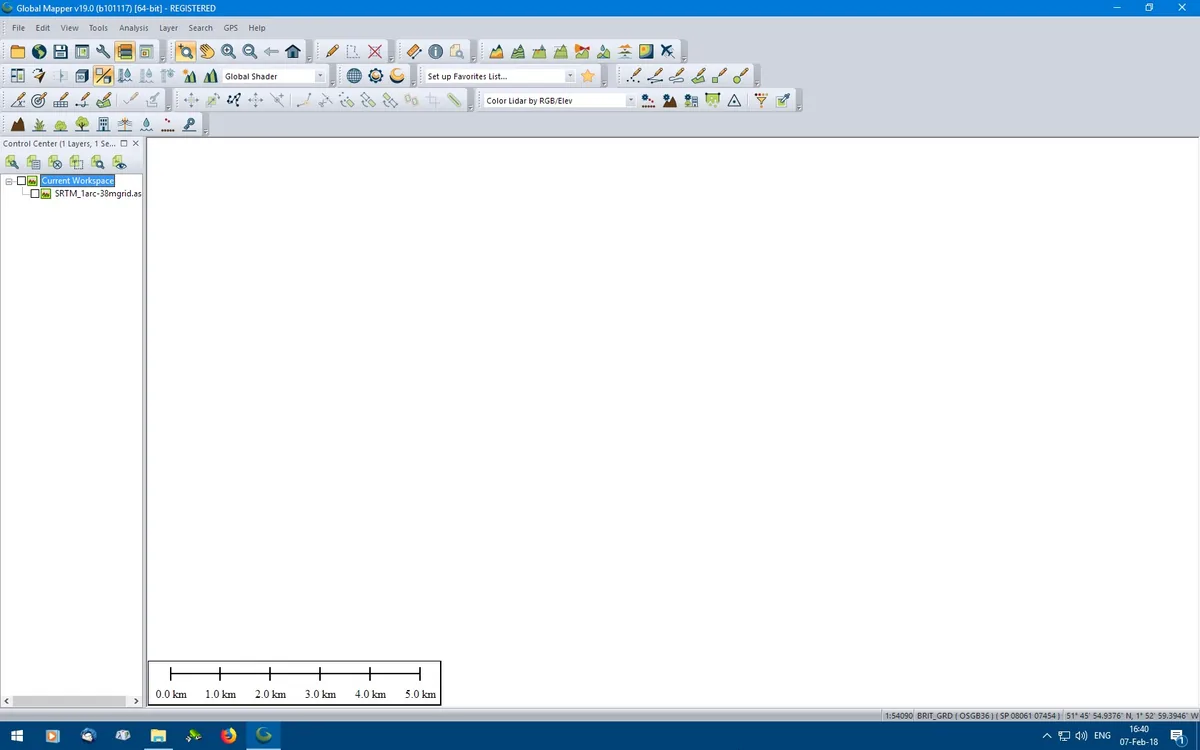
Global Mapper is particularly strong in using lidar data. It is a very good and impressive package for working with 3D data. A Global Mapper licence is currently $599; a Global Mapper Pro licence is $1,349 (February 2022).
And so the list of good packages could go on and on.
Drawing their basic functionality on our generalised road map at a scale of 1:250,000, we can note, to some extent and generally speaking, that:
- Nowadays all of these packages do more or less the same tasks. The core difference is that, through their initial design, some do specific things more elegantly than others or are better suited to specific tasks.
- Furthermore, an important thing to realise is this: GIS packages (as the name suggests) are often designed to manage, analyse and work with existing data. Actually drawing and making new maps is something different.
Interface
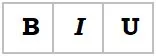
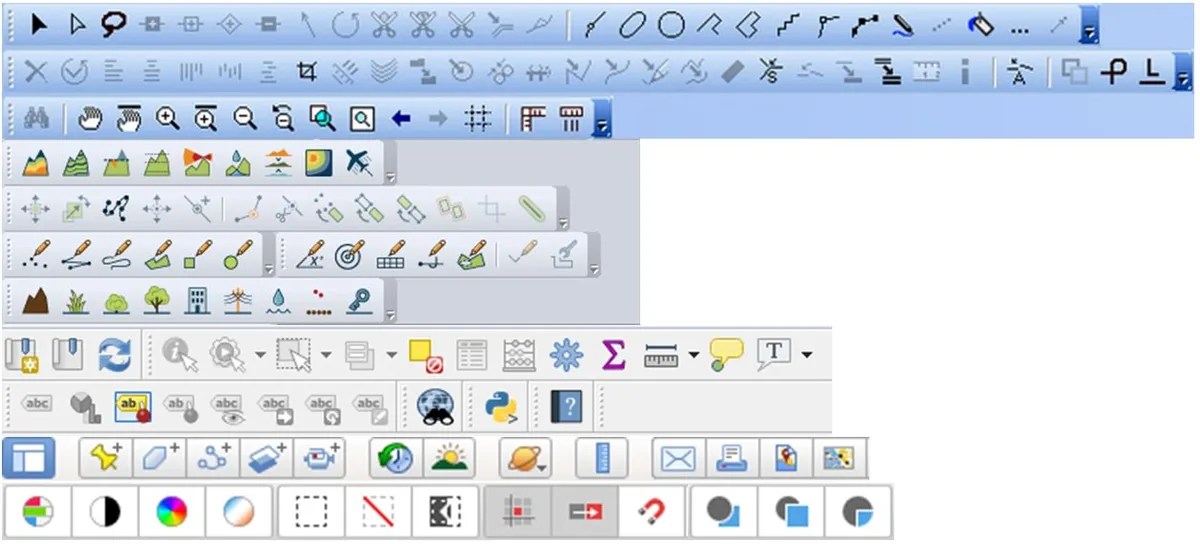
Another important aspect to bear in mind when choosing mapping/GIS software is the interface. The interface is how the software ‘talks’ to us: how we can interact with it. Traditionally this is done through buttons with icons offering speedy access to specific tasks. Icons are good and efficient. Some icons have even become internationally recognisable, like these:
But with digital mapping we need a few more than these three, and then ‘handy icons’ might not be so easy to remember, especially when we are not using the software daily:
Conundrum
Then there is…
Map Maker 5
It was developed in the mid-1990s for a particular target group: those working in international development. It was recognised that good maps are often a foundation stone of proper, sustainable development and that, at that time, digital tools were not available to those working out in the field. The software had to be super user-friendly – after all, not everyone is a GIS expert. It had to be affordable and practical, and it had to have most of the mapping and GIS functionality a professional out in the field might need. You may find it hard to believe but, as professional map makers working across the board, serving many very diverse clients, making simple maps as well as working with complex and huge data sets: in the last 23 years Map Maker has not let us down once! It spans it all, taking you with ease and in a most user-friendly way from A to B:
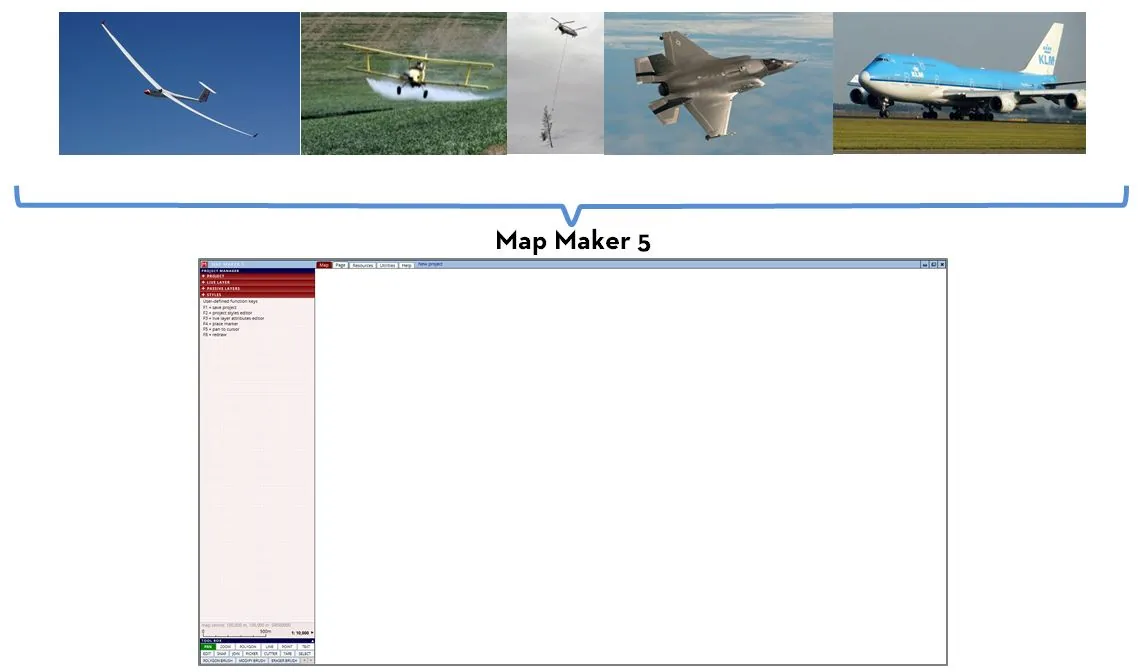
A single licence is £225. An office licence is £895 (both are a one-off payment, with no annual fees).
Users
Map Maker Pro version 3.5 became very popular worldwide because of its impressive set of tools. It has always operated at the cutting edge of what was technically possible. And, speaking of ‘cutting edge’, the seemingly simple ‘cutter’ tool was one such example. It was in Map Maker right from the beginning (the mid-1990s); ArcGIS only introduced a similar tool in about 2012! That is an impressive head start. The interface (more on that below) has always been most user-friendly, whilst its applications have been formidable.
For example:
- Many different users found their way to Map Maker: landowners and agents, farmers, foresters, doctors, ecologists, marine biologists, government officials and various hobbyists.
- Map Maker 5 has been implemented as a very efficient mapping/GIS tool at many estates, land management firms and organisations.
- In the early years, about 1,800 farmers in Central America used a free Spanish version of Map Maker.
- In 2016 we were told that 95% of all government organisations in Ghana that used GIS tools were using Map Maker. That is impressive. Don’t dismiss this thinking that Ghana is just a developing country; it is not. It has online, map-based planning application web portals, etc.
It is impressive that Map Maker can serve this many different users. That was version 3.5; we are now looking at version 5! Again, cutting edge. For example, we have not yet seen the super-efficient ‘brush tool’ functionality in any other GIS package. In terms of user-friendliness, it has left ArcGIS and QGIS far behind.
As professionals, we need good and efficient tools, and therefore we (and most of our clients) use Map Maker. We have found that, whether working with small or super-large data sets or complex GIS work, Map Maker 5 is equal to, if not better than, other packages. Map Maker has remained true to its initial concepts: it is easy for anyone to use, and yet it covers all the tools we need today to draw, analyse and manage maps – for the occasional map maker, the full-time map maker and larger organisations alike.
Map Maker 5 updates and maintenance
Once installed, the software runs for 30 days with its full functionality. After that, it reduces its functionality to a pragmatic set of core tools, which is often enough for the occasional mapper! The software is continuously being improved, expanded and enhanced. Users who want the most up-to-date version of the software should periodically download and install the latest update, free of charge. There are no set times for such releases; they appear as they are completed.
Map Maker 5 and SHP files
Because ArcView ‘rules the world’, Map Maker 5 works seamlessly with SHP files. One can read and write this file format without going through an import or export routine.
Map Maker 5 interface
Because the target users of Map Maker are professionals who need to work with maps but who are not necessarily trained, full-time GIS experts, the developers have chosen a different route when it comes to the interface. All functionality is ‘spelled out’, avoiding icons. The software uses tabs and headers. These tabs hide all options which are not relevant at that stage, so we are not overwhelmed with choices and options we do not need (at a particular stage).
The user can dive deeper and deeper into the options and possibilities or, alternatively, stop at a level of use he or she feels comfortable with. Thus the interface is almost ‘understated’, yet under the bonnet we find the functionality that other map-making or GIS packages also offer.
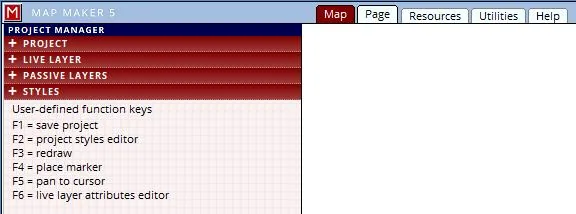
Further to that, in most cases below those headers is a text panel explaining the function of the active tool or tab.
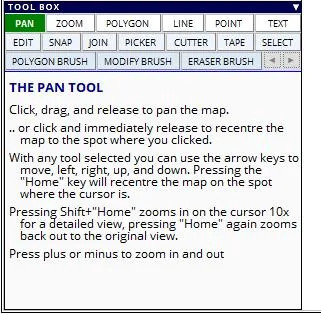
Concluding
This concludes this brief round-up of mapping/GIS tools. We hope this generalised overview and the pointers given have been helpful in considering which software might be useful to you in your specific circumstances.
OK, it is quite a thumbs-up for Map Maker 5. But consider this: we are an independent cartography firm, and as soon as there is a package on the market which is better and more efficient, we will consider changing our preferred tool. For many years Map Maker has been the best choice for us and many of our clients, and we can recommend it for individual users as well as larger organisations.
Latitude Cartography
Links
- ArcGIS: www.esri.com
- MapInfo: www.precisely.com/product/precisely-mapinfo/mapinfo-pro
- Bentley: www.bentley.com
- AutoCAD Map 3D: www.autodesk.com
- QGIS: www.qgis.org
- MAPublisher: www.avenza.com/mapublisher
- Global Mapper: www.bluemarblegeo.com/global-mapper
- Map Maker 5: www.mapmaker.com